Map your organization.
Transform it.
2,300+ questions in bank, ~250 adapted to your profile, 10 analysis axes, an AI that maps your processes, identifies your bottlenecks and generates a concrete action plan. The questionnaire is entirely free.
Org mapping in about a minute.
From your company data to a map of your processes and their bottlenecks — narrated.

Watch on YouTube · 1 min 07 · French voice-over
SME diagnostics are broken.
€15,000
average cost of a consulting audit
Standard methodology. Static PDF report that nobody re-reads after 2 months.
3 to 6 weeks
wait time before results
Time for a firm to mobilize a team, collect, analyze and deliver.
0
personalization in free tools
Same questions for a bakery and a 200-employee industrial company.
72%
of leaders operate without a diagnostic
No budget for a firm. No trust in generic tools.
Solutio estimate
How it works
4 steps from diagnostic to action plan
Create your session
Sign up and enter your SIREN — Carto pre-fills your company profile (identity, financials, risk signals) before the first question.
Answer the packs
2,300+ questions in bank, ~250 adapted to your profile in 10 packs (3 packs free, full questionnaire with Essentiel). Answer at your pace.
AI analysis
The AI analyzes your answers: maturity score, quick wins, pain points, risks.
Action plan
Prioritized roadmap with estimated impact. PDF export. Expert support available.
Your company profile, pre-filled.
Enter your SIREN. Carto queries French public registries and pre-fills your context before the first question — the analysis starts with your real numbers.
- Identity, legal form, capital, directors
- 4 years of financials — revenue, net income, EBITDA, equity, debt
- Risk signals — insolvency proceedings, filings, published accounts (BODACC)
- Competitive & reputation intel, with sources
- You review and validate the profile before starting the diagnostic
Company profile
Aggregated in seconds from official registries — you validate before you start.
A diagnostic calibrated to your industry.
Carto detects your sector from your NAF code and adapts questions, KPIs and benchmarks. Nine industry frameworks — not a generic questionnaire.
Targeted questions
Questions specific to your industry — not the same for a bakery and a 200-person manufacturer.
Sector KPIs
Your reference metrics (day-rate in consulting, food cost in hospitality, MRR & churn in SaaS…) compared to your sector's median and top quartile.
Regulations & risks
The obligations and risks typical of your sector, built into the diagnostic and analysis.
Everything you get
A complete diagnostic of your organization, from analysis to action plan.
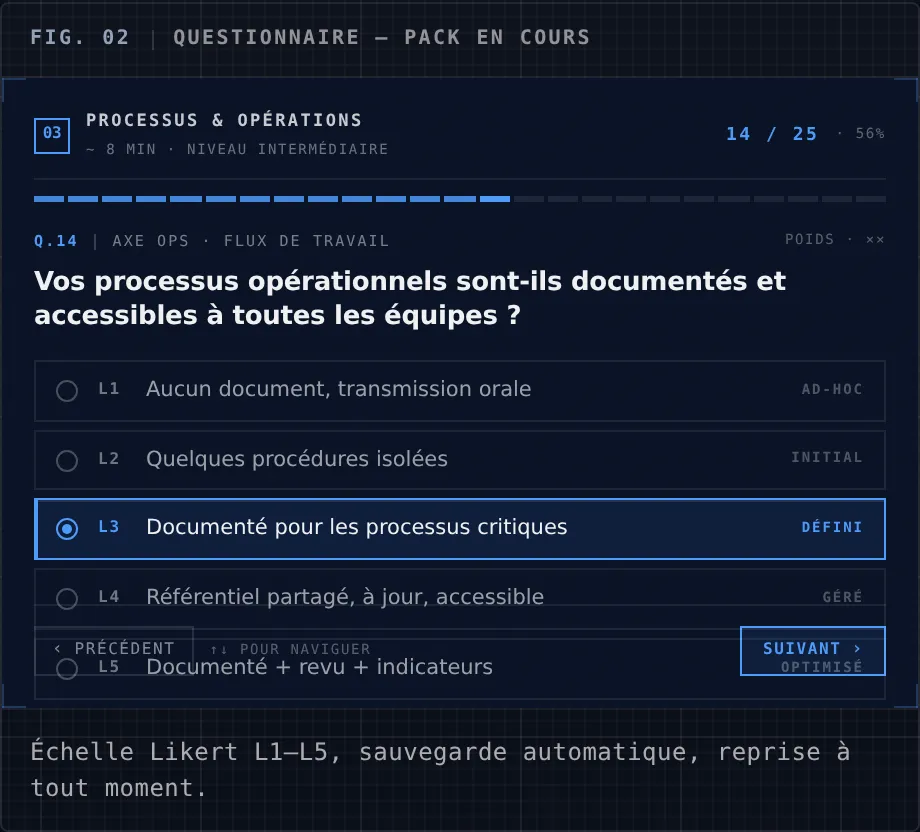
2,300+ questions in bank, 10 axes
The questionnaire covers every aspect of your organization: strategy, processes, tools, HR, finance, innovation. Answer at your own pace, save and resume whenever you want.
- 20 to 30 questions per pack, ~10-15 min each
- Automatic save
- Mix of MCQ and free text
- Designed for SMBs of 10 to 500 people
Intelligent AI analysis
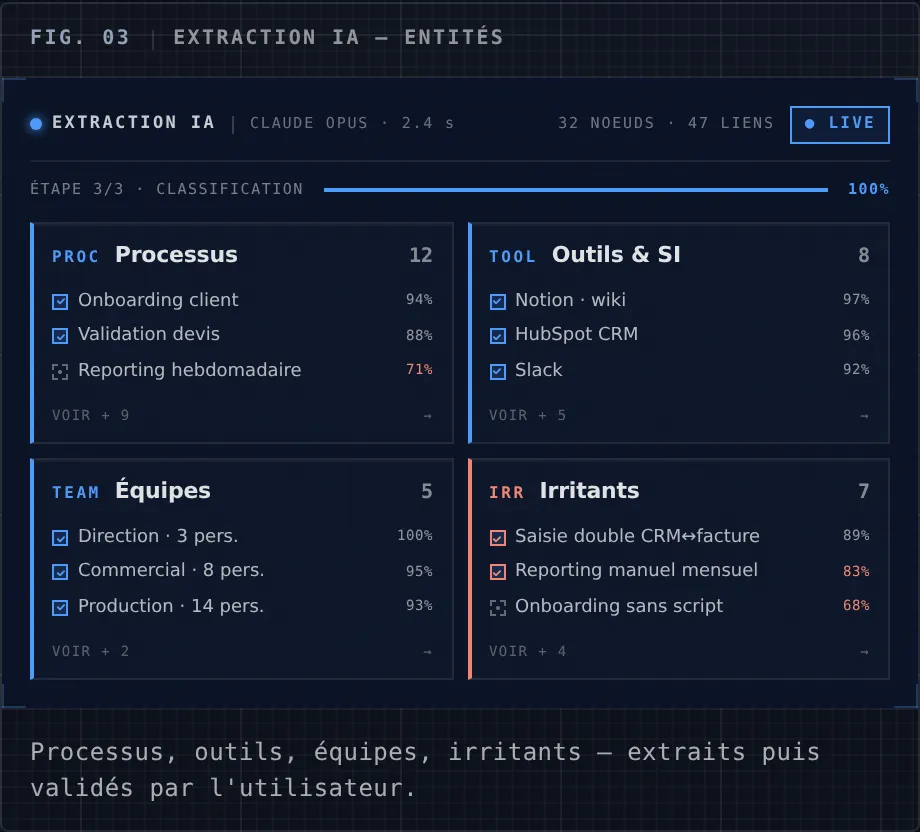
The AI analyzes each pack individually then generates a cross-cutting vision. It detects processes, tools, teams, pain points and manual tasks in your answers.
- Maturity score out of 5 per axis
- Automatic pain point detection
- Prioritized quick wins P1/P2/P3
- Cross-pack causal analysis
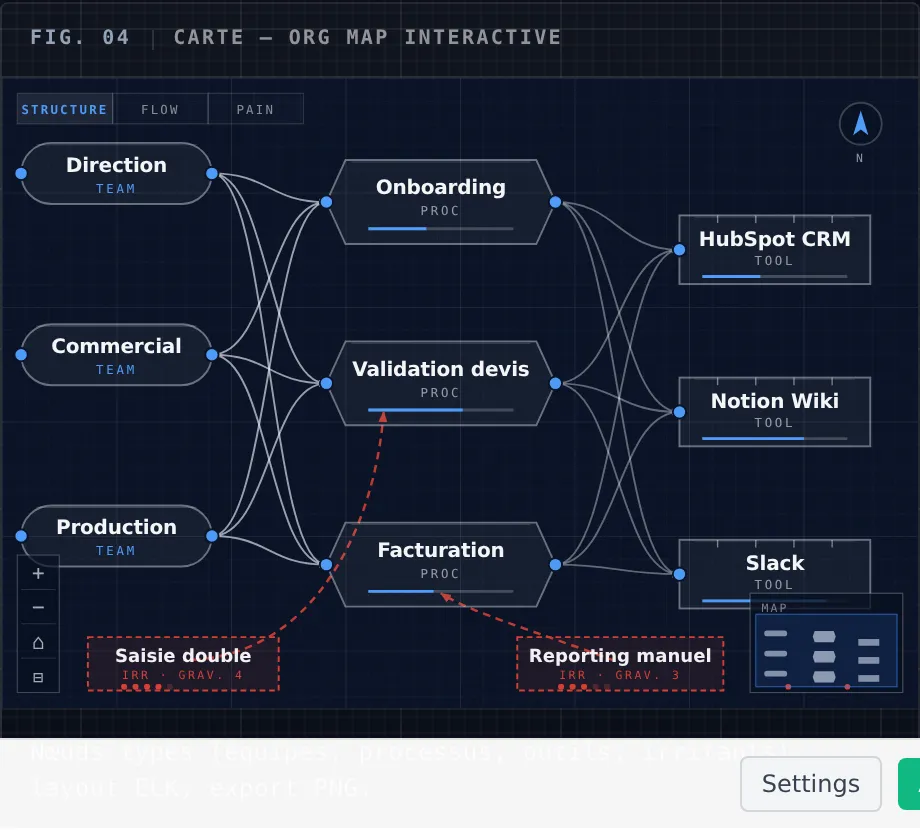
Interactive organizational map
Teams, processes, tools and pain points connected in a graph. Automatic ELK layout, node drill-down, embedded in high resolution into your PDF and deck exports.
- 4 node types: teams, processes, tools, pain points
- Maturity shown per node (amber bar)
- Layout ELK automatique, drill-down sur clic
- High-resolution map embedded in your exports
Maturity radar
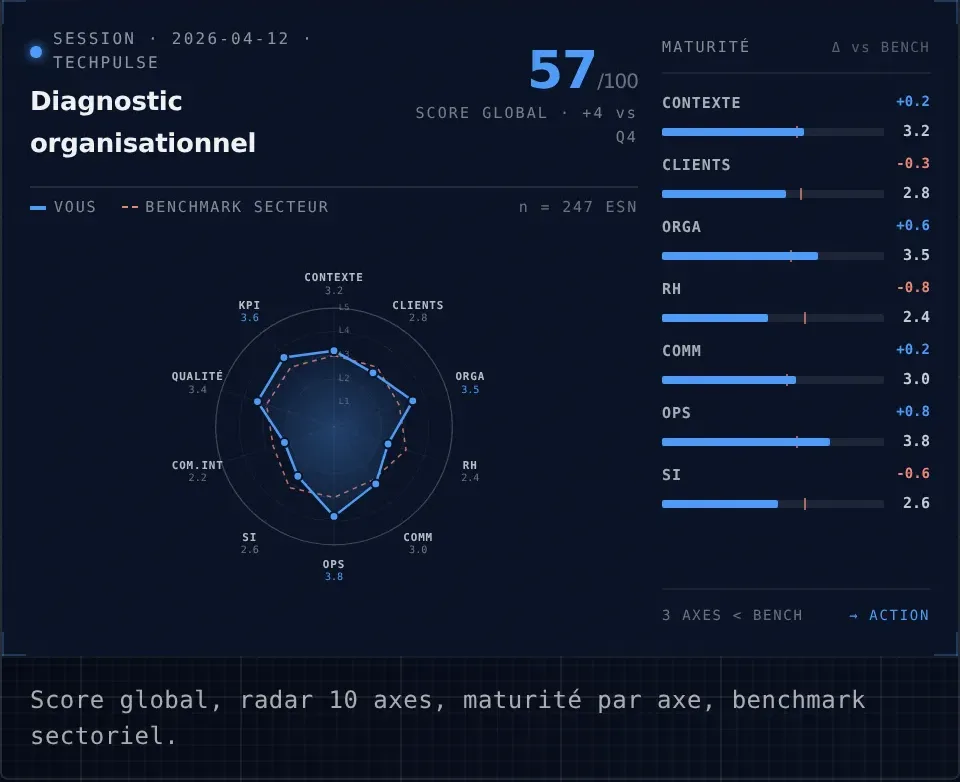
Score on 10 axes with color coding. Instantly visualize your strengths and weaknesses.
Interactive map
Your processes, tools and teams visually connected. Identify missing connections.
Prioritized quick wins
Quick actions ranked by impact and effort. Estimated ROI on each action.
Team diagnostic
Workload, skills, overlaps. See where your teams waste time.
SMART action plan
P1/P2/P3 roadmap over 30/60/90 days. Measurable objectives with KPIs.
Professional export
Complete PDF report to present to your management or steering committee.
The AI analyzes your answers and extracts 6 types of objects.
Each pack automatically generates a structured map of your organization. No generic slides — concrete data.
Processes
5-20 per pack
Flows identified with type, criticality and description.
Tools & IT
3-15 per pack
Software mapped with usage level and detected issues.
Teams
2-8 per pack
Teams and roles with mission and positioning.
Pain points
3-10 per pack
Friction points with severity and impact.
Repetitive tasks
2-8 per pack
Recurring manual tasks with frequency.
Quick wins
2-6 per pack
High-impact opportunities, actionable immediately.
What you get concretely.
Beyond the diagnostic, the tool produces actionable deliverables.
PDF report & PPTX deck
Export a complete PDF report, a PowerPoint deck ready to present to your leadership team, and your raw data as JSON/CSV.
Cost of inaction
The AI quantifies the annual cost of each dysfunction. Lost time, inefficiencies — translated into euros.
Tool recommendations
The AI identifies tools to replace, add, and consolidation opportunities.
Security and privacy by design.
Organizational data is sensitive. Solutio Carto is built to protect it.
EU hosting
Supabase infrastructure hosted in Europe. No data transfers outside the EU.
End-to-end encryption
Data encrypted in transit (TLS 1.3) and at rest (AES-256). Daily backups.
GDPR compliant
Explicit consent, right to erasure, data portability. No resale.
Restricted access
Each session is isolated. Only the creator has access. No sharing with third parties.
Business process mapping is the method of visually representing how your organization actually works day to day: who does what, with which tools, and in what sequence. Where traditional organizational mapping takes weeks of workshops and an outside consulting firm, Solutio Carto automatically builds an interactive map from your answers. In a few hours, your processes, your tools and information systems, your teams and your pain points are extracted, connected and displayed on a map you can explore, filter and share. Designed for SMEs, this approach makes process mapping accessible without a consultant, without complex software and without jargon. You get a clear, big-picture view of your organization, you spot the friction points and you know where to start — all in a single tool, updated as often as you need.
A diagramming tool draws boxes and arrows: it produces a chart, current only as long as you maintain it by hand. Carto doesn't draw, it structures — it extracts your processes, tools, teams and pain points, surfaces the quick wins and produces the analysis plus a report ready to present. A chart illustrates; a map helps you decide.
Carto vs. diagramming tools (Visio, Lucidchart, draw.io)
| Criterion | Solutio Carto | Diagramming tools |
|---|---|---|
| Generation | Auto-extracted from your answers | Manual drawing |
| Real business objects | Processes, Tools, Teams, Pain points | Generic shapes |
| Action plan | Yes | No |
| Updates | Living | Static |
One tool, two ways to use it.
For SME leaders
Make your organization legible and transferable — without hiring a consultant or learning a diagramming tool. Map your processes, spot what depends on a single person, and prepare a key hire, a scale-up or a handover in hours rather than weeks of workshops.
Map my organizationFor firms & consultants — white-label
Map your clients' processes under your brand: your logo, your domain, your deliverables. Hand over an interactive map and a prioritized action plan ready to present, produced in hours instead of days. Turn a one-off engagement into recurring revenue — no other process-mapping software is genuinely resellable white-label.
Become a partnerProcess mapping under your own brand
Drawing canvases (Lucidchart, Miro, draw.io) and BPM software can't be resold under your brand. Solutio Carto can. Organization consultants, accountants, advisory firms and AI consultants industrialize a process-mapping deliverable in their own name: guided questionnaire, auto-extracted map of real business objects, prioritized action plan — repeatable, billable, produced in hours rather than days.
The math makes the case: delivered by a firm, a single process-mapping engagement bills between €1,000 and €8,000. The subscription pays for itself on the first engagement, then every map after that becomes recurring — under your brand, as many times as you want.
Process mapping pairs with the maturity diagnostic to connect the map of your organization to its assessment, inside a single client deliverable.
Map now, at your own pace.
The questionnaire is free. The analysis packs are priced on a quote basis, depending on your scope and needs — a single mission, subscription or white-label. Start free, then we shape the right pack together.
Discovery — free
The full questionnaire, an interactive map preview and your maturity radar. No card, no commitment.
Analysis
The complete report, prioritized pain points and quick wins, and a concrete action plan — ready to present.
Support
Everything in Analysis plus a strategy session with an expert and a personalized roadmap, followed over 30 days.